
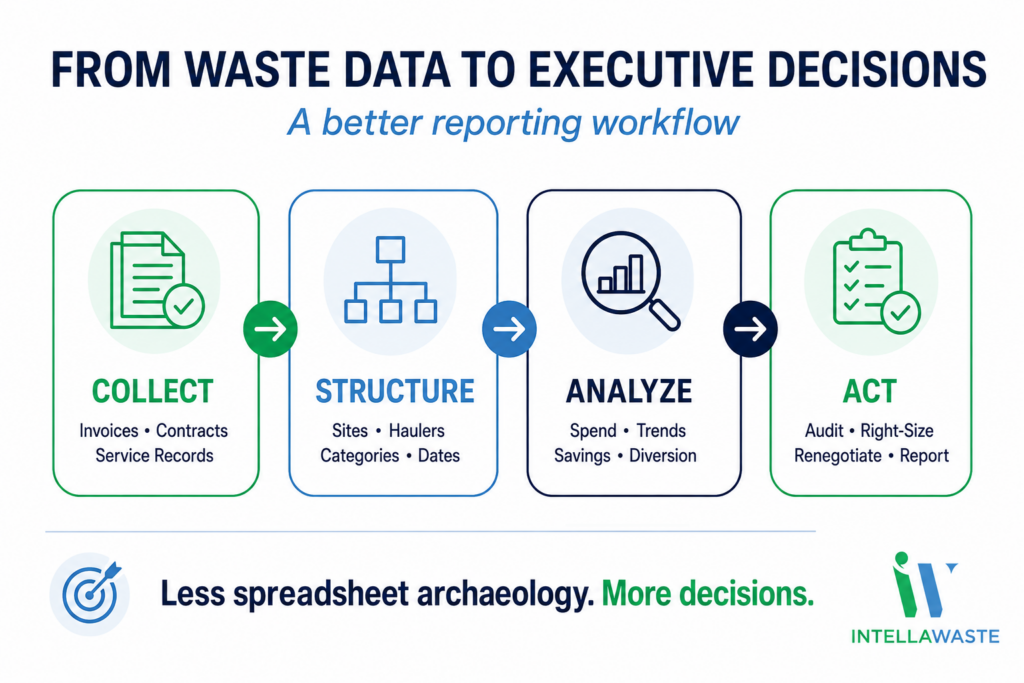
Most waste reports arrive after the useful moment has passed. Someone collects invoices from hauler portals, email attachments and shared drives, reconciles multiple spreadsheets, then builds a presentation explaining what happened last quarter. By the time leadership sees it, the data is already old.
That is not really waste management reporting. It is spreadsheet archaeology.
Executives do not need another dense report filled with disconnected totals. They need a clear view of what the organization is spending, why costs are changing, where savings are being produced and which issue deserves attention next.
For waste brokers and consultants, that same visibility has another purpose: it gives clients continuing proof that the relationship is delivering value.
The difference begins long before a dashboard is built. It begins with the way invoice, contract, service and location data enter the system.
Why Traditional Waste Reporting Stays Stuck in the Past
Waste data rarely starts in a format designed for analysis. One hauler sends a PDF. Another posts invoices to a portal. A third uses different descriptions for the same container or service.
Contracts live in separate folders, service changes sit in email threads and local managers may keep their own records.
The reporting team has to reconstruct the story by hand.
The Source Data Is Fragmented
An invoice can show what one location was billed for one period, but it does not automatically explain whether the rate matched the contract, whether a fee was new or how that location compares with similar sites.
When data remains trapped in documents, every useful question creates more manual work.
To compare spend by hauler, someone has to standardize names. To analyze service categories, someone has to interpret inconsistent line items. To find a trend, someone has to assemble several months of history and hope the columns still match.
The Report Becomes a Separate Monthly Project
If a dashboard depends on manually updated spreadsheets, reporting is not part of the operating workflow. It is an extra process layered on top of it.
That creates delays, version-control problems and numbers that finance, operations and procurement may calculate differently.
The result may look polished, but executives still have to ask:
- Is this information current?
- What is driving the change?
- Can we trace this total back to the original invoices?
- Who is responsible for addressing the problem?
Totals Explain the Past but Do Not Direct the Next Move
A portfolio total may confirm that waste costs increased. It does not identify whether the cause was an authorized contract escalation, higher disposal charges, added service, an unusual group of locations or billing errors.
Useful reporting narrows the distance between a number and a decision.
A total without context creates another question. A well-structured report points to the sites, services and exceptions that need review.
Better Waste Management Reporting Starts With Structured Data
The reporting layer is only as reliable as the data beneath it.
A modern system should collect invoice information as it arrives, parse individual line items and connect each charge with the correct location, hauler, service category and reporting period. Contract terms and service levels should sit alongside that billing history—not in separate folders.
That structure changes reporting from a recurring research assignment into a byproduct of daily operations.
IntellaWaste’s automatic invoice upload and parsing tools are designed to turn incoming hauler documents into organized, traceable records. The original invoice remains available, but the information inside it can be filtered, compared and analyzed instead of retyped each time someone needs a report.
This is especially important for multi-location organizations. As explained in our guide to multi-site waste management software, a consolidated portfolio view helps teams compare locations on common terms without pretending every site operates under identical conditions.
The Five Reporting Views Executives Actually Use
An executive dashboard does not need to display everything the platform knows. It needs to answer the questions leaders are responsible for answering.
1. Spend by Site, Category and Hauler
The top-line number matters, but the breakdown creates the decision.
Leaders should be able to view total waste spend and then move quickly into the dimensions that explain it:
- Location or region
- Hauler
- Waste, recycling, organics and other service categories
- Recurring service, disposal, fuel and ancillary charges
- Current period compared with budget or a prior baseline
This view makes outliers visible.
A high-cost site may have a valid operational reason for spending more, or it may be over-serviced, paying unusual fees or operating under an outdated contract. The report should help the team distinguish between those possibilities.
2. Cost and Service Trends Over Time
A single month can be noisy. Trend lines show whether a change is temporary or becoming the new normal.
Executives benefit from seeing monthly spend alongside service information such as container size, pickup frequency and extra service activity.
When cost rises but the service profile stays the same, the team knows to investigate rates, surcharges and fees. When both cost and service increase, leaders can ask whether the operational change was planned and is still necessary.
Trend reporting also improves budgeting. Instead of carrying the latest invoice total forward, finance can identify recurring cost creep, seasonal patterns and contract-driven increases before the next budget is finalized.
3. Savings Identified, Recovered and Sustained
Savings reports often lose credibility because every opportunity is presented as if the money has already been realized.
Executive reporting should separate the stages clearly:
- Identified opportunity
- Validated discrepancy or optimization
- Credit or rate correction secured
- Recurring savings tracked against a defined baseline
That distinction prevents inflated totals and gives leadership a defensible view of impact. It also shows whether a correction lasted.
Catching one overcharge is useful. Confirming that subsequent invoices remained accurate is stronger.
For waste brokers and consultants, this view is central to the value story. It connects the work being performed with documented financial outcomes the client can review.
4. Sustainability and Diversion Metrics
Sustainability reporting becomes more useful when it is connected to the same service and invoice records used for financial management.
Depending on the source data available, reporting may include:
- Spend by waste stream
- Service volumes
- Reported weights
- Recycling activity
- Landfill diversion
- Changes against an established baseline
The methodology should remain consistent, and estimated figures should be labeled as estimates rather than presented as measured results.
This gives sustainability teams a clearer operating baseline and helps them identify where progress is occurring.
It can also reveal a financial opportunity. If recycling volume has increased but trash service has never been adjusted, the organization may be paying for capacity it no longer needs.
5. Exceptions, Owners and Next Actions
The most useful executive report ends with action, not observation.
An exception view can surface:
- Unusual price changes
- Recurring ancillary fees
- Service-level outliers
- Unresolved billing discrepancies
- Contracts approaching renewal windows
- Locations with unexpected increases
Each priority should have an owner, status, estimated or confirmed impact and next step.
This turns the dashboard into a management tool. Instead of spending the meeting debating which number is correct, the team can decide what to investigate, renegotiate or change.
What Makes an Executive Dashboard Credible?
More charts do not make a report more useful. Credibility comes from consistency and traceability.
Every key figure should use a defined calculation. Site comparisons should group genuinely comparable operations. Savings should use an agreed baseline. Sustainability measures should identify their source and methodology.
Users should also be able to move from a summary total to the relevant line items and original invoices.
That drill-down matters when an executive asks, “Why did this region increase?”
The answer should not require three days of research. The report should show the locations and charge categories responsible while preserving the supporting records needed to verify the conclusion.
The best dashboards also make room for context. A location may be an outlier because of local regulations, restricted access, seasonal volume or a temporary project.
Data should focus attention, not replace operational judgment.
For Waste Brokers, Client-Facing Reporting Is a Retention Tool
Brokers and consultants often create substantial value that clients do not see directly.
Invoices are collected. Billing discrepancies are resolved. Service changes are coordinated. Contract dates are monitored.
When this work is invisible, the relationship can be reduced to a monthly invoice and a few email threads.
Client-facing reports make the work visible.
A clear dashboard can show what the client spent, what changed, which issues were caught, how much was recovered and what the broker recommends next.
Quarterly reviews become strategic conversations rather than retrospective status updates. Clients gain answers before they have to ask for them.
That transparency strengthens retention because it makes the broker’s role easier to understand and harder to replace.
It also supports growth. A brokerage with repeatable reporting can add accounts without rebuilding custom spreadsheets for every new client—one of the system changes discussed in how to scale a waste brokerage.
Build Reporting Into the Operating Rhythm
A dashboard creates value when it becomes part of how the organization works.
Finance may review spend and budget variance monthly. Operations can work a weekly exception queue. Procurement can monitor contract timing and hauler performance. Sustainability teams can review service-stream and diversion trends on a consistent schedule.
Brokers can use the same source data to prepare client reviews and document savings.
Different audiences may need different views, but they should not need different versions of the truth.
This is where structured, current data changes the conversation. The team stops asking, “Can we assemble the numbers?” and starts asking, “What should we do about what the numbers show?”
Turn Waste Data Into Decisions With IntellaWaste
Effective waste management reporting should do more than summarize invoices. It should explain cost, reveal change, document results and direct the next action.
IntellaWaste helps waste brokers, consultants and multi-site organizations bring invoice data, contracts, service levels, auditing and financial reporting into one connected system.
Teams can spend less time rebuilding history and more time acting on what is happening across the portfolio.
Book an IntellaWaste demo to see how structured waste data can support clearer executive reporting, stronger client reviews and better operating decisions.