
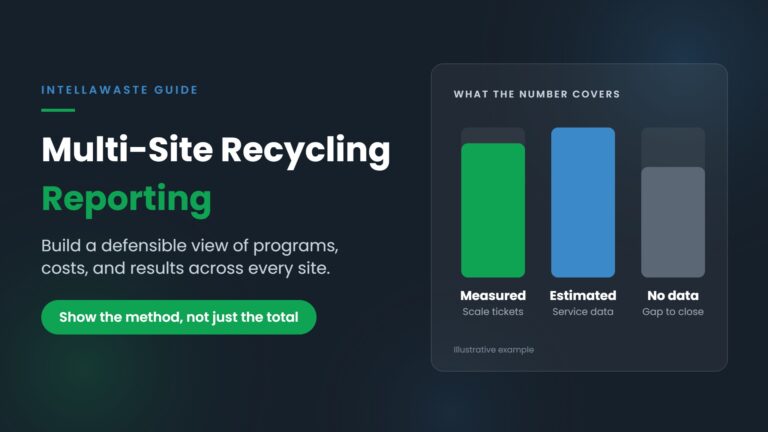
Multi-site recycling reporting is where good intentions meet uneven data. One store sends weight tickets. Another has a cardboard baler and a rebate check. A third has a recycling container on the invoice and nothing else. Leadership still wants one number for the portfolio, and the sustainability team wants a number it can defend when a client, an auditor, or an executive asks how it was built.
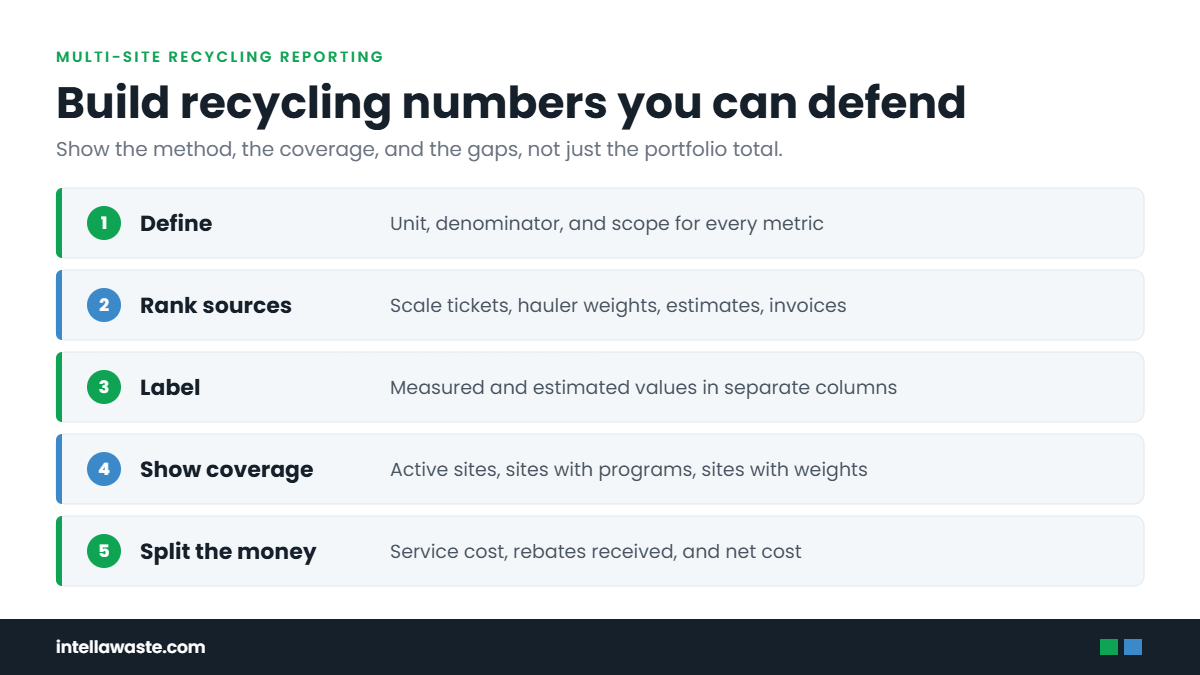
This article lays out a method for building that view: define each metric before you calculate it, rank your data sources, separate measured values from estimates, show coverage and reporting periods, treat cost and rebates as their own lines, and document the gaps. It also draws one line clearly. Invoice and service records can show what programs exist, what they cost, and how service changed. On their own, they may not establish how much material was actually diverted.
What Multi-Site Recycling Reporting Has to Prove
A recycling report answers three different questions, and most portfolio reports blend them together.
Program questions. Which sites have a recycling program, for which materials, and since when? This is an inventory question. Service records and contracts can usually answer it.
Cost questions. What does each program cost, what does it return in rebates, and how does that compare with trash service at the same site? This is a financial question. Invoices answer most of it.
Results questions. How much material left each site as recycling instead of trash, and what share of the total waste stream does that represent? This is a measurement question. It needs weights, or a documented and consistent basis for estimating them.
Our earlier guide to waste management reporting for executives covers the full set of views a leadership team uses, including sustainability metrics as one of five. This article goes one level deeper on that single view: how to build recycling numbers that hold up when someone asks for the method.
Define Every Metric Before You Calculate It
Most disputes over recycling numbers are definition disputes. Two people use the same word for different calculations, and both are technically right. Write the definitions down before the first report goes out.
Program coverage
The share of active sites with at least one recycling stream in service. State what counts as “active” and what counts as a “program.” A site with a cardboard container that has not been picked up in four months is a different situation from a site with weekly single-stream service.
Recycling volume
Say what unit you mean. Tons, pounds, cubic yards, pulls, and lifts are not interchangeable. A cubic yard of loose cardboard and a cubic yard of compacted organics weigh very different amounts. If the report mixes units, it is not a total. It is a sum of unlike things.
Diversion rate
Recycled material divided by total material generated, over the same period, at the same sites, in the same unit. The denominator is where most diversion rates go wrong. If recycling weight comes from 40 sites with scale tickets and trash volume comes from all 120 sites, the rate is meaningless.
Net program cost
Recycling service charges, minus rebates actually received, for the same sites and period. Keep gross cost, rebates, and net cost as three separate figures so readers can see how the result was reached.
Build a Source Hierarchy for Multi-Site Recycling Reporting
Not every source carries the same weight of evidence. A source hierarchy ranks the data you have so the report always uses the strongest available source for each site and labels what it used. The table below is one way to set it up.
| Tier | Source | What it can support | How to label it |
|---|---|---|---|
| 1 | Scale tickets or certified weight reports from the hauler or processor | Measured tonnage by stream and site | Measured |
| 2 | Hauler-reported weights without site-level tickets | Reported tonnage, subject to the hauler’s method | Reported |
| 3 | Service records: container size, service type, pickup frequency, plus a documented fill and density assumption | Estimated volume or weight | Estimated (state the assumption) |
| 4 | Invoice line items for recycling service | Program existence, service charges, rebates | Cost and program data only |
| 5 | Site manager statements or surveys | Program context and operating notes | Qualitative |
Two rules make the hierarchy useful. First, label each site’s number by the weakest source behind it. Second, the report shows how much of the portfolio sits in each tier. A portfolio total that is 80% measured tells a very different story from one that is 80% estimated, even when the totals match.
The hierarchy depends on clean records underneath it. If site lists, vendor accounts, and service profiles are out of date, the report will assign tiers to the wrong locations. Our waste data quality cleanup checklist covers that master-data layer.
Separate Measured Values From Estimates
Estimates are not a problem. Unlabeled estimates are. Many portfolios will never have scale tickets for every site, and estimating from container size and pickup frequency is a reasonable way to fill the gap if the team writes the method down and applies it the same way everywhere.
A defensible estimate states four things:
- The service data used (container count, size, service type, frequency)
- The fill-level assumption, such as an assumed percentage full at pickup
- The density factor used to convert volume to weight, by material
- The source of those assumptions and the date the team set them
Report measured and estimated figures in separate columns, then show the combined total with a note on the share that is estimated. If measured data later replaces an estimate, keep the old figure in the history and record the change. Otherwise year-over-year comparisons will show “improvement” that is really a change in method.
Why Coverage Matters in Multi-Site Recycling Reporting
Coverage is the share of the portfolio that a number actually describes. It is the single most useful line a recycling report can add, and the one most often left out.
A practical coverage note gives three counts: active sites in the portfolio, sites with a recycling program on record, and sites with measured or reported weights for the period. If those counts are 120, 85, and 40, a diversion rate built only from those 40 sites describes a third of the portfolio. That can still be useful. It just has to say so.
Coverage also exposes sites that have no recycling data because nobody connected the records, not because there is no program. Brokers and consultants who manage several clients see this often: a recycling hauler billing a different entity, or a program a site set up on its own that never reached the central record. The centralized waste management governance matrix we published earlier explains how to make sure local program changes return to the shared record.
Keep Reporting Periods Consistent
Multi-site recycling reporting breaks down quickly when inputs cover different periods, and recycling and trash data rarely arrive on the same calendar. A hauler may bill on a cycle that does not match the month. Weight reports may come quarterly. Rebates often post one or two months after the material moved.
Pick a reporting period and align every input to it. When a source does not match the period, either prorate it with a stated method or hold it out and note the gap. Do not combine a quarter of trash tonnage with a month of recycling weights, and do not count a rebate in the quarter it posted if the material moved in the prior quarter without noting it.
Seasonality matters too. Retail cardboard volume around the holidays, school-year cycles at education sites, and summer peaks at hospitality locations all distort short-period comparisons. Compare like periods year over year rather than month over month when seasonality is strong.
Treat Costs and Rebates as Their Own Lines
Recycling cost belongs in the report, but it should not be blended with results. A program can be cost-effective and low-volume, or high-volume and expensive. Readers need to see both.
Report recycling service charges by site and stream, rebates received (not promised), and net cost. Rebates tied to commodity prices will move from period to period for reasons that have nothing to do with site performance, so show them separately from service cost rather than netting them silently.
Recycling data also has a direct link to trash spend. When recycling volume at a site grows, the trash service at that site may no longer match what the site actually generates. That is a waste service right-sizing question, and recycling reporting is often the first place it shows up.
Why Invoice Data Alone May Not Establish Diversion
Invoices are the most complete record many portfolios have, which makes it tempting to build diversion figures from them. An invoice can show that a recycling container was serviced, how often, and what it cost. It usually cannot show how full the container was, how much it weighed, or whether the load was accepted as recycling or rejected for contamination.
That means invoice data supports program and cost reporting well. It supports volume estimates when paired with documented assumptions. It does not, by itself, prove that a given tonnage was diverted from landfill. If a report converts invoice line items into tons and presents the result as a diversion rate, show the method on the page and label the figure as an estimate.
Contamination is the other gap. A pickup billed as recycling may include loads the processor sent to landfill because of contamination. Unless the hauler or processor reports rejected loads, the report cannot account for them. Note that limitation rather than assuming every recycling pickup was recycled.
The same principle applies to service records more broadly: what was billed and what happened are related but separate facts. Our guide to waste service verification explains that distinction for invoices.
A Multi-Site Recycling Reporting Checklist
Before a recycling report goes to leadership or a client, confirm each of the following:
- Each metric has a written definition, unit, and denominator.
- Every site’s figure carries its source tier.
- Measured and estimated values appear in separate columns.
- Each estimation assumption has a source, a date, and consistent use.
- Coverage is shown: active sites, sites with programs, sites with weights.
- All inputs cover the same reporting period, or the report notes the gap.
- Service cost, rebates received, and net cost are separate lines.
- Contamination and rejected loads appear in the report or on the gap list.
- A change log records any method change from the prior period.
- Diversion claims appear only where the measurement basis supports them.
A report that passes this list will still have gaps. The difference is that the gaps are visible, which makes the report safer to share and more useful for deciding where better data is worth the effort.
Where IntellaWaste Fits
The foundation of recycling reporting is a reliable record of what service each site has. IntellaWaste’s Service Level Tracking records the number of containers, container size, type of service, and frequency of pickup for every customer location, across all programs. Combined with total yards or tons produced, that service record is the basis IntellaWaste uses for landfill diversion reporting.
IntellaWaste uploads invoices, reads each line item, and assigns every invoice to the correct customer location automatically, so recycling service charges sit next to trash spend for the same site and period. Hauler contract tracking and invoice auditing check those charges against contract terms. See the full feature set on the IntellaWaste waste management software products page. Pricing is $5 per location per month with unlimited invoices, and there is no minimum number of locations.
Bottom Line
Multi-site recycling reporting earns trust by showing its work. Define each metric, rank your sources, label estimates, show coverage, align periods, keep cost and rebates separate, and do not ask invoice data to prove more than it can. A smaller number with a clear method is worth more than a larger one nobody can explain.
To see how IntellaWaste organizes service levels, invoices, and contracts for every location in one record, book a demo of IntellaWaste.
IntellaWaste provides waste management software solutions for businesses across the United States.