
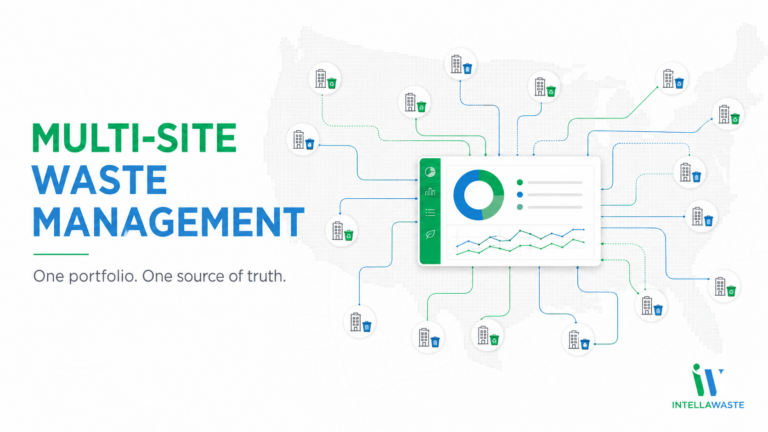
Multi-site waste management software should do more than collect invoices in one place. It should show finance, procurement, and facility leaders what is happening across the entire portfolio—where costs are drifting, which sites are outliers, whether service levels still fit actual needs, and where the organization has negotiating leverage.
That sounds straightforward. In practice, waste data is often fragmented before it ever reaches a central team. One location uses a national hauler. The next relies on a regional provider. Another has a locally negotiated agreement that no one at corporate has reviewed in years. Invoices arrive by email, paper, PDF, and vendor portal, each with different descriptions, fee structures, and billing cycles.
The company may know its total waste expense. What it usually cannot see is why that number is what it is.
Why Waste Spend Becomes Invisible at Scale
Every site has its own version of normal
A single waste invoice can be difficult to evaluate without context. Across hundreds of locations, the comparison becomes much harder. Container sizes vary. Pickup frequencies vary. Some sites include recycling or organics. Others pay separate providers for each service stream. Local taxes, surcharges, access requirements, and market conditions add more variation.
When every site is described differently, portfolio leaders cannot make a clean comparison. A high-cost location may have a legitimate operational reason for spending more—or it may simply be over-serviced, out of contract, or paying rates that were never challenged.
Invoices are documents, not decision-ready data
An invoice tells you what one hauler billed one account for one period. It does not automatically tell you how that site compares with similar locations, whether the billed rate matches the contract, or whether the service schedule makes sense relative to the rest of the portfolio.
Spreadsheets can summarize a portion of this information, but only after someone gathers the invoices, interprets inconsistent line items, and keys the data into a common structure. At enterprise scale, that process is slow, difficult to maintain, and usually outdated by the time the report is finished.
Contract terms get separated from billed charges
Many visibility problems begin because invoices and contracts live in different systems. The invoice may be in accounts payable, the agreement in a shared drive, the service schedule with a facilities manager, and the renewal date in someone’s calendar.
Without those records connected, teams can see what they paid but not whether they should have paid it.
What Unified Waste Data Makes Possible
Benchmark sites on comparable terms
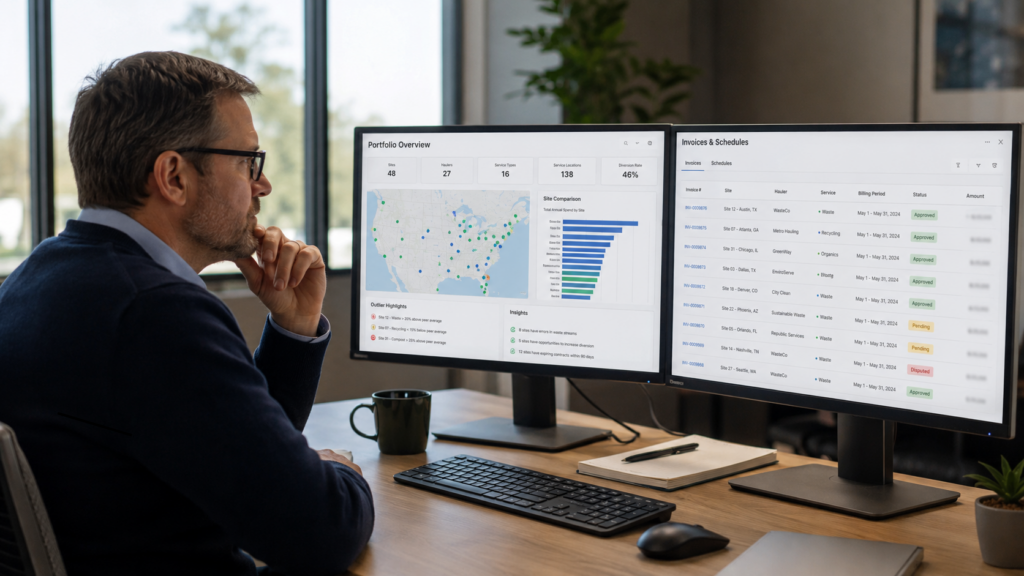
The first benefit of centralized data is comparison. Instead of reviewing locations as isolated accounts, teams can group similar sites and evaluate them using consistent measures.
Useful views may include monthly cost per site, cost per pickup, cost by container size, spend by service category, or cost per square foot when facility data is available.
The purpose is not to force every site into the same service plan. It is to establish a credible range for what similar operations should cost. Once that range is visible, unusual results become much easier to investigate.
Find outliers before they become permanent
A portfolio view turns exceptions into a working queue. One location may be paying far more than its peers for the same container and pickup schedule. Another may show recurring extra pickups that local staff did not request. A closed or paused site may still be billed. A surcharge may move at one account while remaining unchanged everywhere else.
None of these issues is especially dramatic on a single invoice. The value comes from identifying patterns across the portfolio and reviewing the specific locations that fall outside them.
That lets a central team focus its attention where the financial impact or operational risk is highest.
Right-size service using evidence
Waste service often remains on autopilot long after a site’s needs change. Pickup frequency may have been set during a busier season. A location may have reduced operating hours. A recycling program may have shifted material out of the trash stream, but the trash schedule never changed.
Unified service and invoice data helps teams compare what each site receives with what similar sites require. That creates a practical right-sizing process: identify locations with unusually high service frequency, confirm conditions with the site, test a change, and measure the result.
The goal is not fewer pickups at any cost. It is the right service level without paying for unused capacity.
Negotiate as one portfolio
Fragmented data creates fragmented buying power. If every contract is managed site by site, each location enters negotiations with limited volume and limited history.
When contract dates, service profiles, hauler performance, and total portfolio spend are visible together, procurement can approach the market with a stronger position.
The organization can identify contracts approaching renewal, group compatible locations, build accurate service specifications, and compare bids on the same basis. Even when one national agreement is not the right answer, portfolio-wide data helps teams negotiate regional groups from a position of evidence rather than guesswork.
Why a Dashboard Alone Is Not Enough
A clean dashboard is useful only when the underlying data is complete and current. If teams still have to chase invoices, retype charges, and manually match each bill to a contract, the dashboard becomes another month-end project.
Effective multi-site waste management software needs a reliable data layer beneath the reporting. That means bringing invoices into one workflow, parsing charges into consistent fields, connecting billed rates with contract terms, tracking service levels, and preserving the source documents behind every number.
IntellaWaste’s waste management software tools connect invoice automation, contract tracking, service-level visibility, auditing, and reporting so the portfolio view does not depend on a manually maintained spreadsheet.
Once data arrives in a common structure, reporting becomes a byproduct of the workflow instead of a separate research assignment. Finance gets cleaner cost visibility. Facilities can review service exceptions. Procurement can see renewal opportunities. Sustainability teams can work from consistent service and diversion data where available.
A Practical Rollout Across Hundreds of Locations
Build a complete location and service inventory
Start with the operating reality: every open location, every active hauler, each account number, container type, pickup frequency, service stream, and known contract.
This inventory becomes the control list used to find missing accounts, duplicate services, and locations that should no longer be billed.
Normalize the incoming data
Different haulers may use different names for similar services. Those charges need to be mapped into consistent categories before comparison is meaningful.
Automated invoice collection and parsing can remove much of the repetitive work, while exception handling addresses invoices that do not fit the expected pattern.
Establish the baseline before setting targets
Create a clear view of current spend, contracted rates, service levels, and renewal dates. Then segment comparable sites and identify the first outliers.
This baseline prevents teams from setting savings targets based on an incomplete or distorted picture.
Work the exceptions, then measure the result
Prioritize items with the clearest business case: incorrect rates, closed-site billing, unexplained recurring fees, unusual service frequencies, and contracts nearing a negotiation window.
Record what changed and track the result so savings and service improvements remain visible after the initial project ends.
For a more detailed foundation, see How to Track Waste Spending Across Locations for the core spend-tracking workflow that supports this portfolio-level approach.
Who Should Own Multi-Site Waste Visibility?
Waste touches several departments, which is one reason ownership becomes unclear. Accounts payable sees the invoices. Facilities sees missed pickups and overflowing containers. Procurement sees contract terms. Sustainability teams see diversion goals. Local managers see what happens at the site.
The strongest operating model gives one central team responsibility for the data and the process while keeping local teams involved in exceptions.
Corporate leaders should not need site managers to build reports, but they do need them to confirm operational facts when the data flags a problem. Clear ownership turns the platform into a management system rather than another place to store documents.
The Portfolio Advantage Is Already There
A company with hundreds of locations already has scale. The missing piece is often the ability to see and use it.
Scattered invoices hide patterns. Disconnected contracts weaken timing. Site-by-site decisions reduce leverage. Unified data reverses each of those conditions.
With a consistent view across locations, waste becomes a manageable portfolio expense. Teams can benchmark sites, investigate outliers, right-size service, prepare negotiations earlier, and explain exactly what changed.
The result is not simply better reporting. It is better control.
IntellaWaste helps waste brokers, consultants, and multi-site operators centralize invoice data, monitor contracts and service levels, audit charges, and report across the portfolio. Book a demo to see what your waste operation looks like when every location is visible in one system.